Informative Design - Projects

Eunice Lo Set Tze (0334512)
Informative Design
Projects
Instructions
Lecture Notes
Week 1
We were told to make presentation slides on this week's flip classroom topic which was about Manuel Lima's 9 Directives Manifesto which are :
1. Form Follows Direction
2. Interactivity is Key
3. Cite Your Source
4. The Power of Narrative
5. Do Not Glorify Aesthetics
6. Look for Relevancy
7. Embrace Time
8. Aspire for Knowledge
9. Avoid Gratuitous Visualizations
Week 2
For this week's class, our lecture presentation is about Saul Wurman's "L.A.T. C. H." where we learn about the 5 ways to organize our information correctly.
L - Location
A - Alphabet
T - Time
C- Category
H- Hierarchy
Week 3
We presented about Miller's Law (Chunking) for this week's class where chunking is a concept that originates from the field of cognitive psychology. Chunking allows people to take smaller bits of information and group them into something meaningful.
So, we gave examples on :
- Infographics
- Web, app or games
- Processes (e.g. recipes)
Week 6
We did a presentation on the different types of infographics and the online tools used to make an infographic. We found around 8 types of infographics.
Exercise 1 : Quantifying and Visualize Data
Week 1
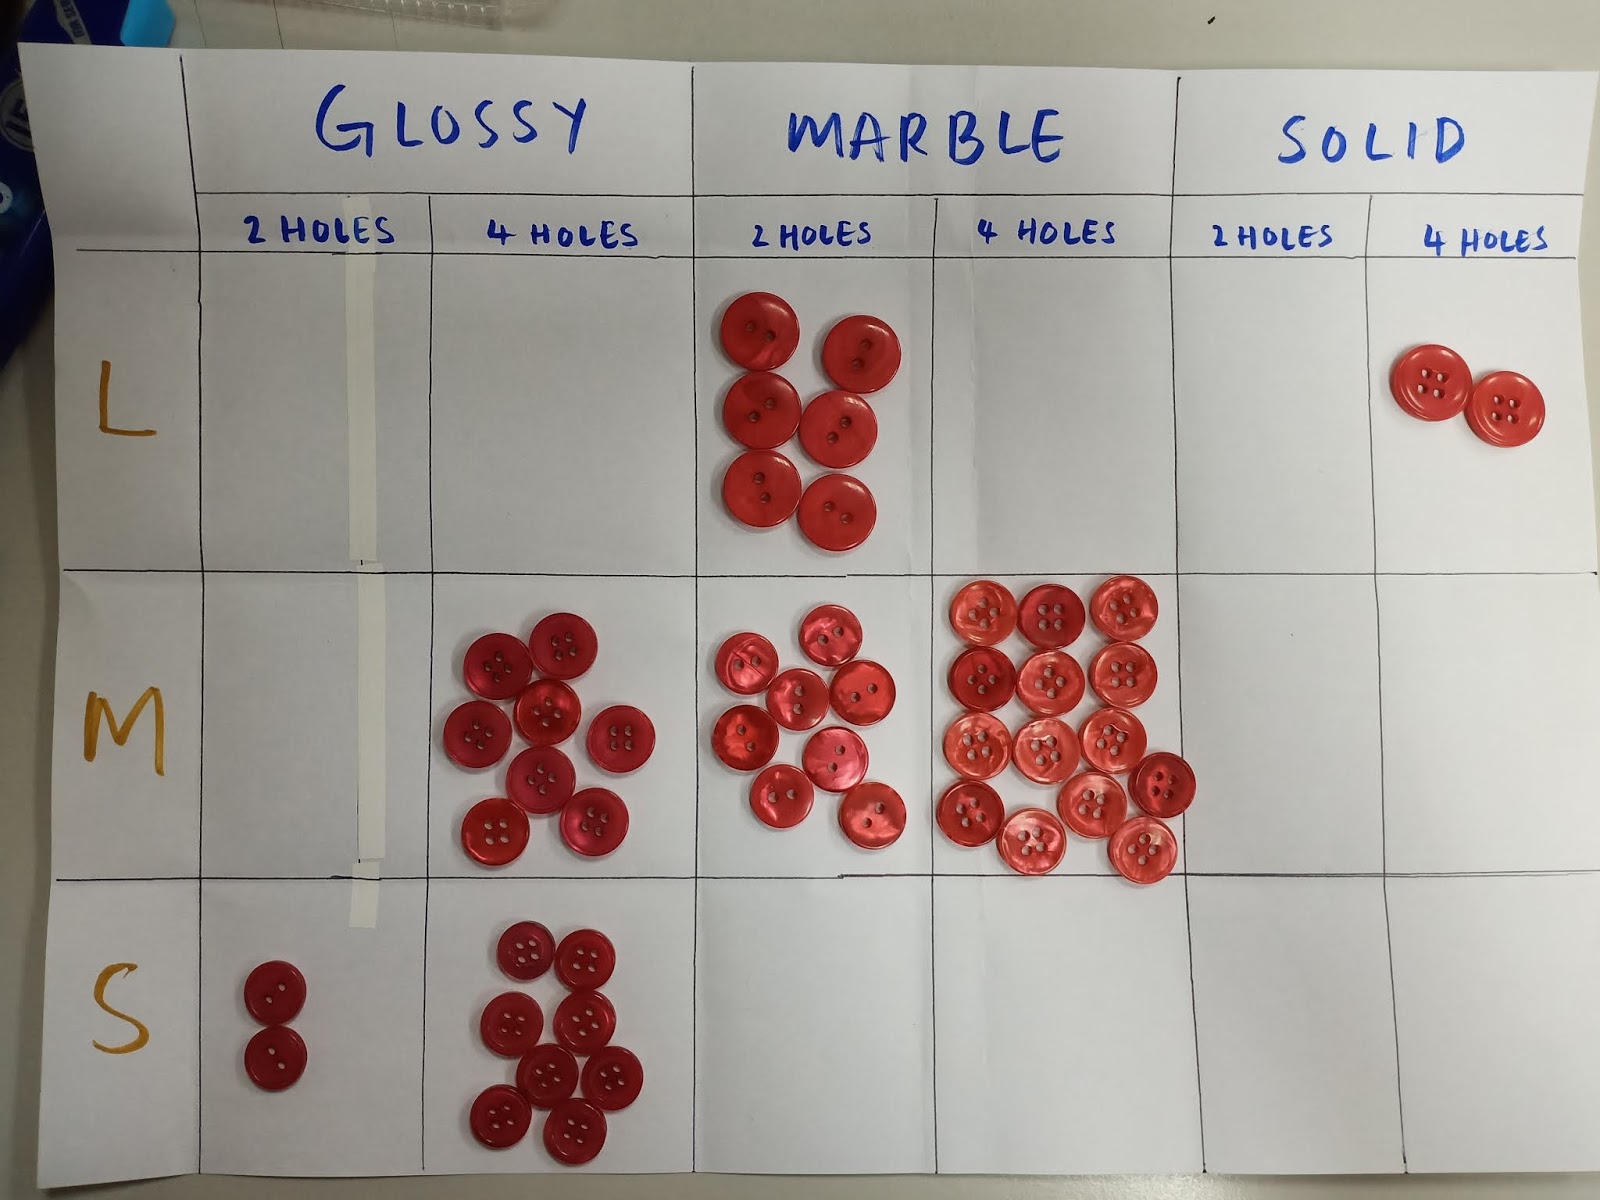
For this week's class we were told to choose a set of buttons with a color and make an infographic poster about it. So, I decided to group up the buttons according to their patterns or textures.

Then, I created a table to group them up.
Week 2
For this week, we were told to create a Pokemon Infographic Poster and follow according to Saul Wurman's "LATCH". So, I started off by listing down the things and information I want to categorize.


Then, after settling with my ideas, I proceed to sketch out on how I wanted it to be.

After that, I begin with my background by painting them out using photoshop and came out with these
 |
| For fire type pokemon (volcano) |
 |
| For flying type pokemon (sky) |
 |
| For ice type pokemon (snowy mountains) |
 |
| For plant type pokemon (grass) |
 |
| The board I did using Illustrator |
 |
| Tracing out the icons to make it look better |
After completing it, I compiled everything together to form a poster.
 |
| it came out as neat and simple as I wanted it to be |
And here is the PDF version for a better look of it :
Project 1 - Instructable Infographic Poster
Week 3
For this week, we begin our project by choosing a recipe that we wanted to use and extract the information to form an infographic poster that we want. So, I decided to go for Chocolate Brownies as they are my favourite desserts to eat.
I went and searched for their recipe and used bbcgoodfood.com's recipe as it has the most information that I needed to form my infographic.
Here is the link :
https://www.bbcgoodfood.com/recipes/best-ever-chocolate-brownies-recipe
Then, after receiving my feedbacks, Miss Anis told me to add on Blondie recipe to my infographic so, i searched for the recipe :
https://www.bbcgoodfood.com/recipes/white-chocolate-blondies
Week 4
I started out by looking for inspirations on how I want my designs to be like, so I searched some up on Pinterest.


Week 4
I started out by looking for inspirations on how I want my designs to be like, so I searched some up on Pinterest.


Then, I proceeded to draw out my ingredients for the infographic.

After that. I started to draw out the steps

Week 6
I continued doing my steps and then started to combine everything into one infographic. I decided to use pastel colours because I like the tone and warm feeling it gives out like it feels homey.

Then, I decided to stick with it because I feel like its well categorized and not that messy and everywhere.
So here is the final outcome that I've decided on :

I also added a fun fact where we can actually make Blondies with just the same steps and just change a few of the ingredients as Blondies are like the cousins of Brownies but using white chocolate to make it.
Week 7
However, after a few considerations and getting an opinion from one of my classmates and friend, I decided to refined it even more because I do agreed that the boxes and graphics are very out of place and too near to the edge of the background. So, I decided to add a gap so that it will look better and not weird. I also rearranged everything and categorized them in boxes so that it looks even more neat and pleasant to the eyes. My friend told me to not worry about not being able to see it nicely because it's an A3 size anyways, so my previous one will look super big.
So, here is the outcome :

Project 2 - Animated Infographic Video
Week 7
I started out by animating my infographic on Adobe After Effects using simple and easy skills. I used the same colour swatches as my infographic poster.


After completing my animating, I began choosing some happy and upbeat song since my animate is pretty fast due to the time limit given which was 1 minute max. So, I ended up with this song because I felt like it's pretty catchy.
After finishing, I rendered my video and began uploading on my Youtube channel.
Final Project - Animated Infographic
Week 1
For the first week of class, we were told to be in groups of 4 (me, Wen Jun, Jojo and Chan Hee) and to draw lots for our main theme for our Infographic poster. So, our leader got the topic 'Water'. Then, we are to decide on our topic.
Here are the list of ideas we agreed to as a group :
1. What if water never existed?
2. What i water made out of ?
3. Is human able to live underwater?
After that, we decided to go for idea no. 1 and Mr Shamsul agreed to it as he felt like the topic is very interesting.
Then, we are split into a few roles which are :
- Script writer : Chan Hee
- Illustration : Wen Jun & Jojo
- After Effects : Wen Jun & Jojo
- Voice : Eunice (me)
Week 2
We did our mood board for our ideas and inspiration for our animated infographic video where we had to include these information in our mood board :
- Graphic style
- Typefaces
- Color scheme
- Transition style
- Animation/motion style
Week 3
Me and Chan Hee started to draw out our storyboard. I drew half of it then she drew the other half.


Week 4
Then, we did our animatics before starting out our project.
Week 6
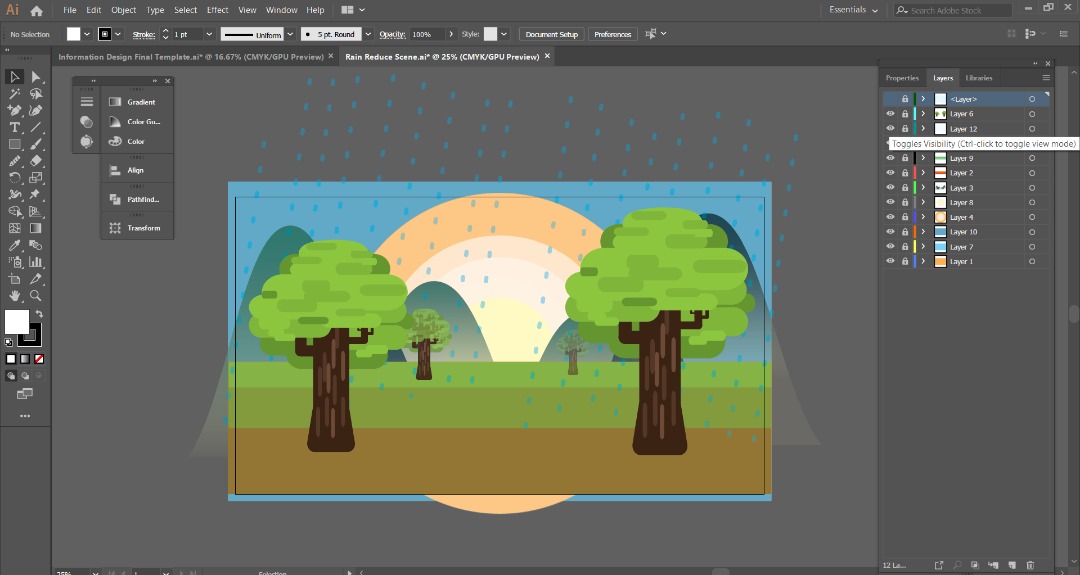
Wen Jun and Han started out the animation by illustrating the small things on Illustrator.

Week 7 - until submission date (1/3/2019)
Then they proceeded on drawing out the animation on Illustrator.


I did my voice recording too and they gave me feedbacks like I should make my voice sound happier and I should talk slightly faster. So, here is the outcome :


Finally, we've finished our final animate video. Here is the link :

After that. I started to draw out the steps

Week 6
I continued doing my steps and then started to combine everything into one infographic. I decided to use pastel colours because I like the tone and warm feeling it gives out like it feels homey.

Then, I decided to stick with it because I feel like its well categorized and not that messy and everywhere.
So here is the final outcome that I've decided on :

I also added a fun fact where we can actually make Blondies with just the same steps and just change a few of the ingredients as Blondies are like the cousins of Brownies but using white chocolate to make it.
Week 7
However, after a few considerations and getting an opinion from one of my classmates and friend, I decided to refined it even more because I do agreed that the boxes and graphics are very out of place and too near to the edge of the background. So, I decided to add a gap so that it will look better and not weird. I also rearranged everything and categorized them in boxes so that it looks even more neat and pleasant to the eyes. My friend told me to not worry about not being able to see it nicely because it's an A3 size anyways, so my previous one will look super big.
So, here is the outcome :

Project 2 - Animated Infographic Video
Week 7
I started out by animating my infographic on Adobe After Effects using simple and easy skills. I used the same colour swatches as my infographic poster.

Then I proceed to do the steps and animate them a little bit to show a few movements


After completing my animating, I began choosing some happy and upbeat song since my animate is pretty fast due to the time limit given which was 1 minute max. So, I ended up with this song because I felt like it's pretty catchy.
After finishing, I rendered my video and began uploading on my Youtube channel.
Final Project - Animated Infographic
Week 1
For the first week of class, we were told to be in groups of 4 (me, Wen Jun, Jojo and Chan Hee) and to draw lots for our main theme for our Infographic poster. So, our leader got the topic 'Water'. Then, we are to decide on our topic.
Here are the list of ideas we agreed to as a group :
1. What if water never existed?
2. What i water made out of ?
3. Is human able to live underwater?
After that, we decided to go for idea no. 1 and Mr Shamsul agreed to it as he felt like the topic is very interesting.
Then, we are split into a few roles which are :
- Script writer : Chan Hee
- Illustration : Wen Jun & Jojo
- After Effects : Wen Jun & Jojo
- Voice : Eunice (me)
Week 2
We did our mood board for our ideas and inspiration for our animated infographic video where we had to include these information in our mood board :
- Graphic style
- Typefaces
- Color scheme
- Transition style
- Animation/motion style
Week 3
Me and Chan Hee started to draw out our storyboard. I drew half of it then she drew the other half.


Week 4
Then, we did our animatics before starting out our project.
Week 6
Wen Jun and Han started out the animation by illustrating the small things on Illustrator.

Week 7 - until submission date (1/3/2019)
Then they proceeded on drawing out the animation on Illustrator.

I did my voice recording too and they gave me feedbacks like I should make my voice sound happier and I should talk slightly faster. So, here is the outcome :
Finally, we've finished our final animate video. Here is the link :


Comments
Post a Comment